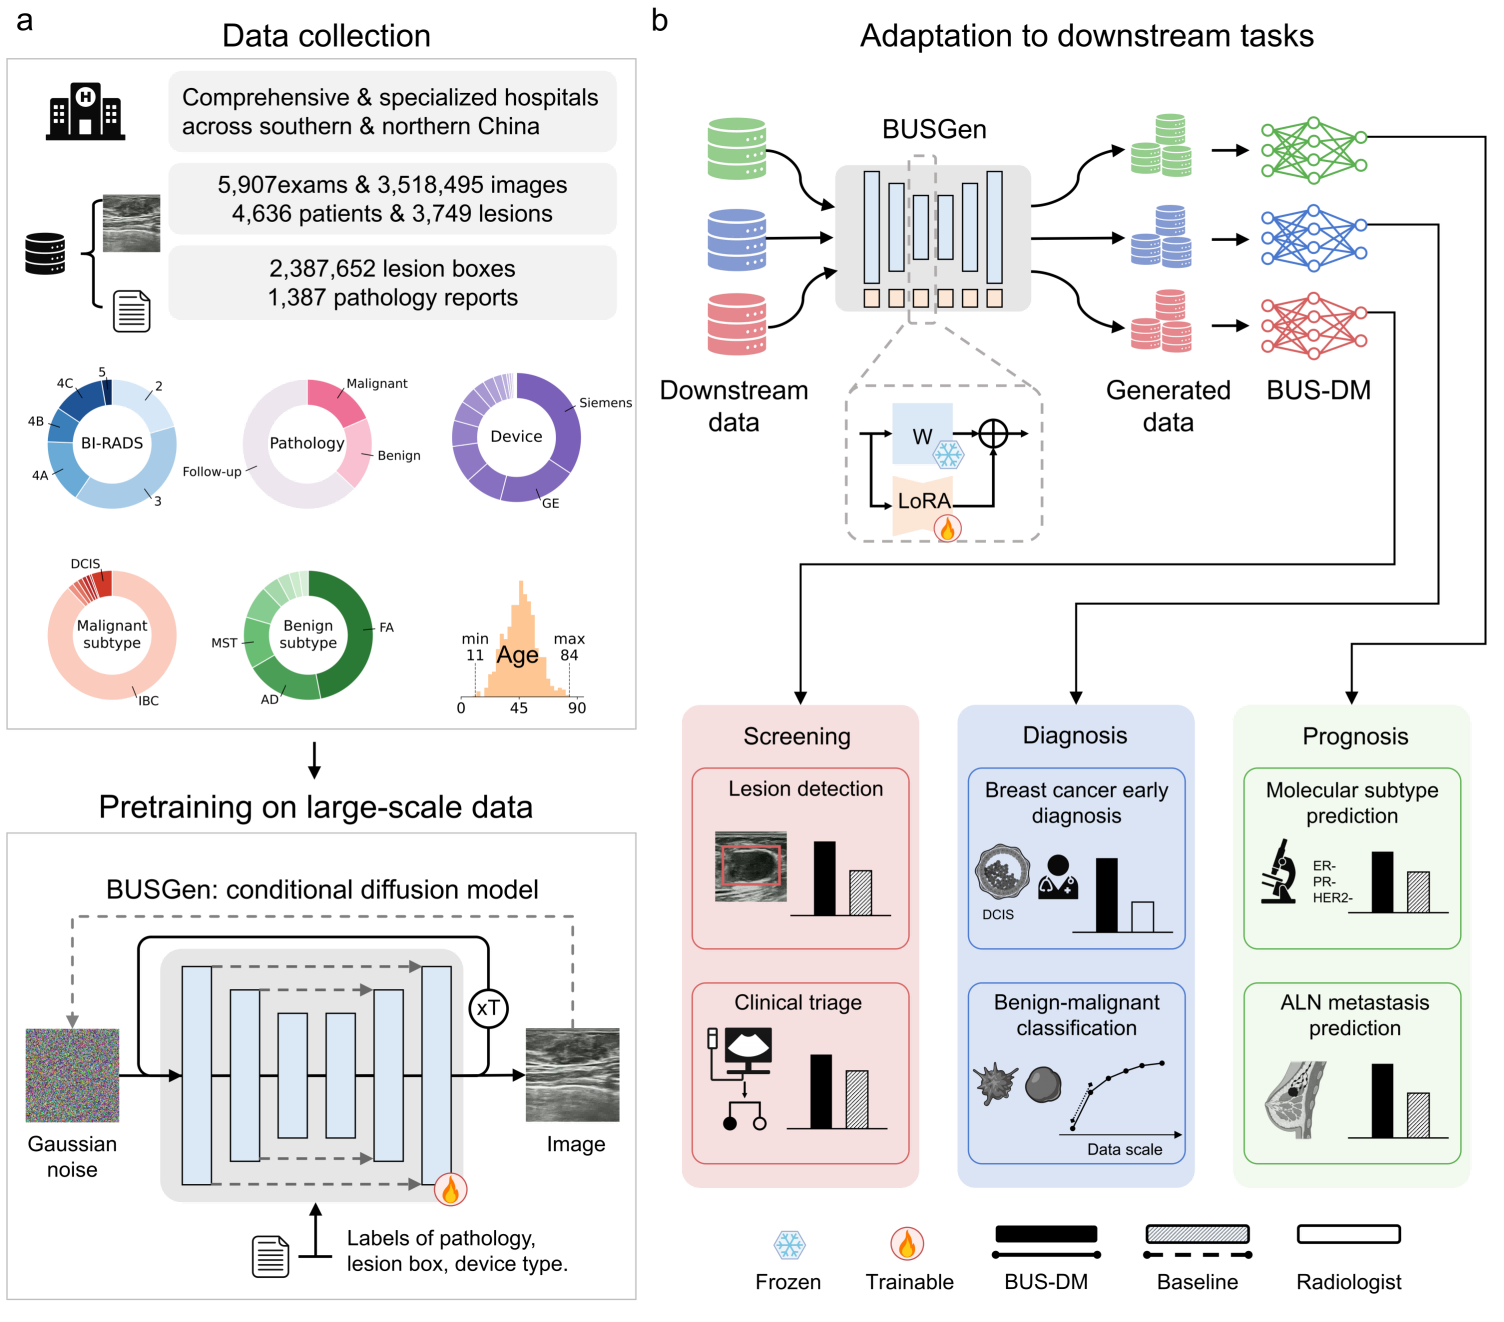
The schematic overview of the BUSGen pretraining and adaptation framework. a, Over 3.5 million breast ultrasound images of 5,907 examinations of 4,636 patients and 3,749 lesions were collected. These data were annotated by clinical experts and were used for the conditional generation task to pretrain the BUSGen model, enabling it to learn rich data distribution and generate high-quality images through an iterative refinement process repeated T times. The pretraining task incorporated conditions of the labels of pathology, lesion box, and device type. b, The pretrained BUSGen can be adapted to various downstream tasks, generating unlimited, informative data resources and facilitating the development of downstream models. To preserve the rich information acquired during pretraining, we froze the pretrained parameters and fine-tuned low-rank adapters (LoRA). In comparison to baseline models, the BUSGen-based downstream models (BUS-DMs) achieved superior performance in a wide range of tasks across breast cancer screening, diagnosis and prognosis.
A Foundational Generative
Model for
Breast
Ultrasound Image
Analysis
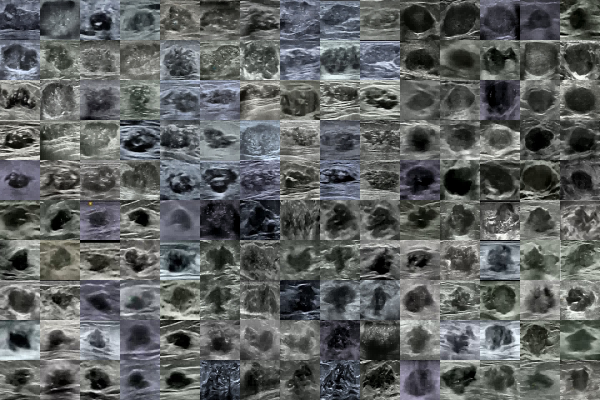
Generated images
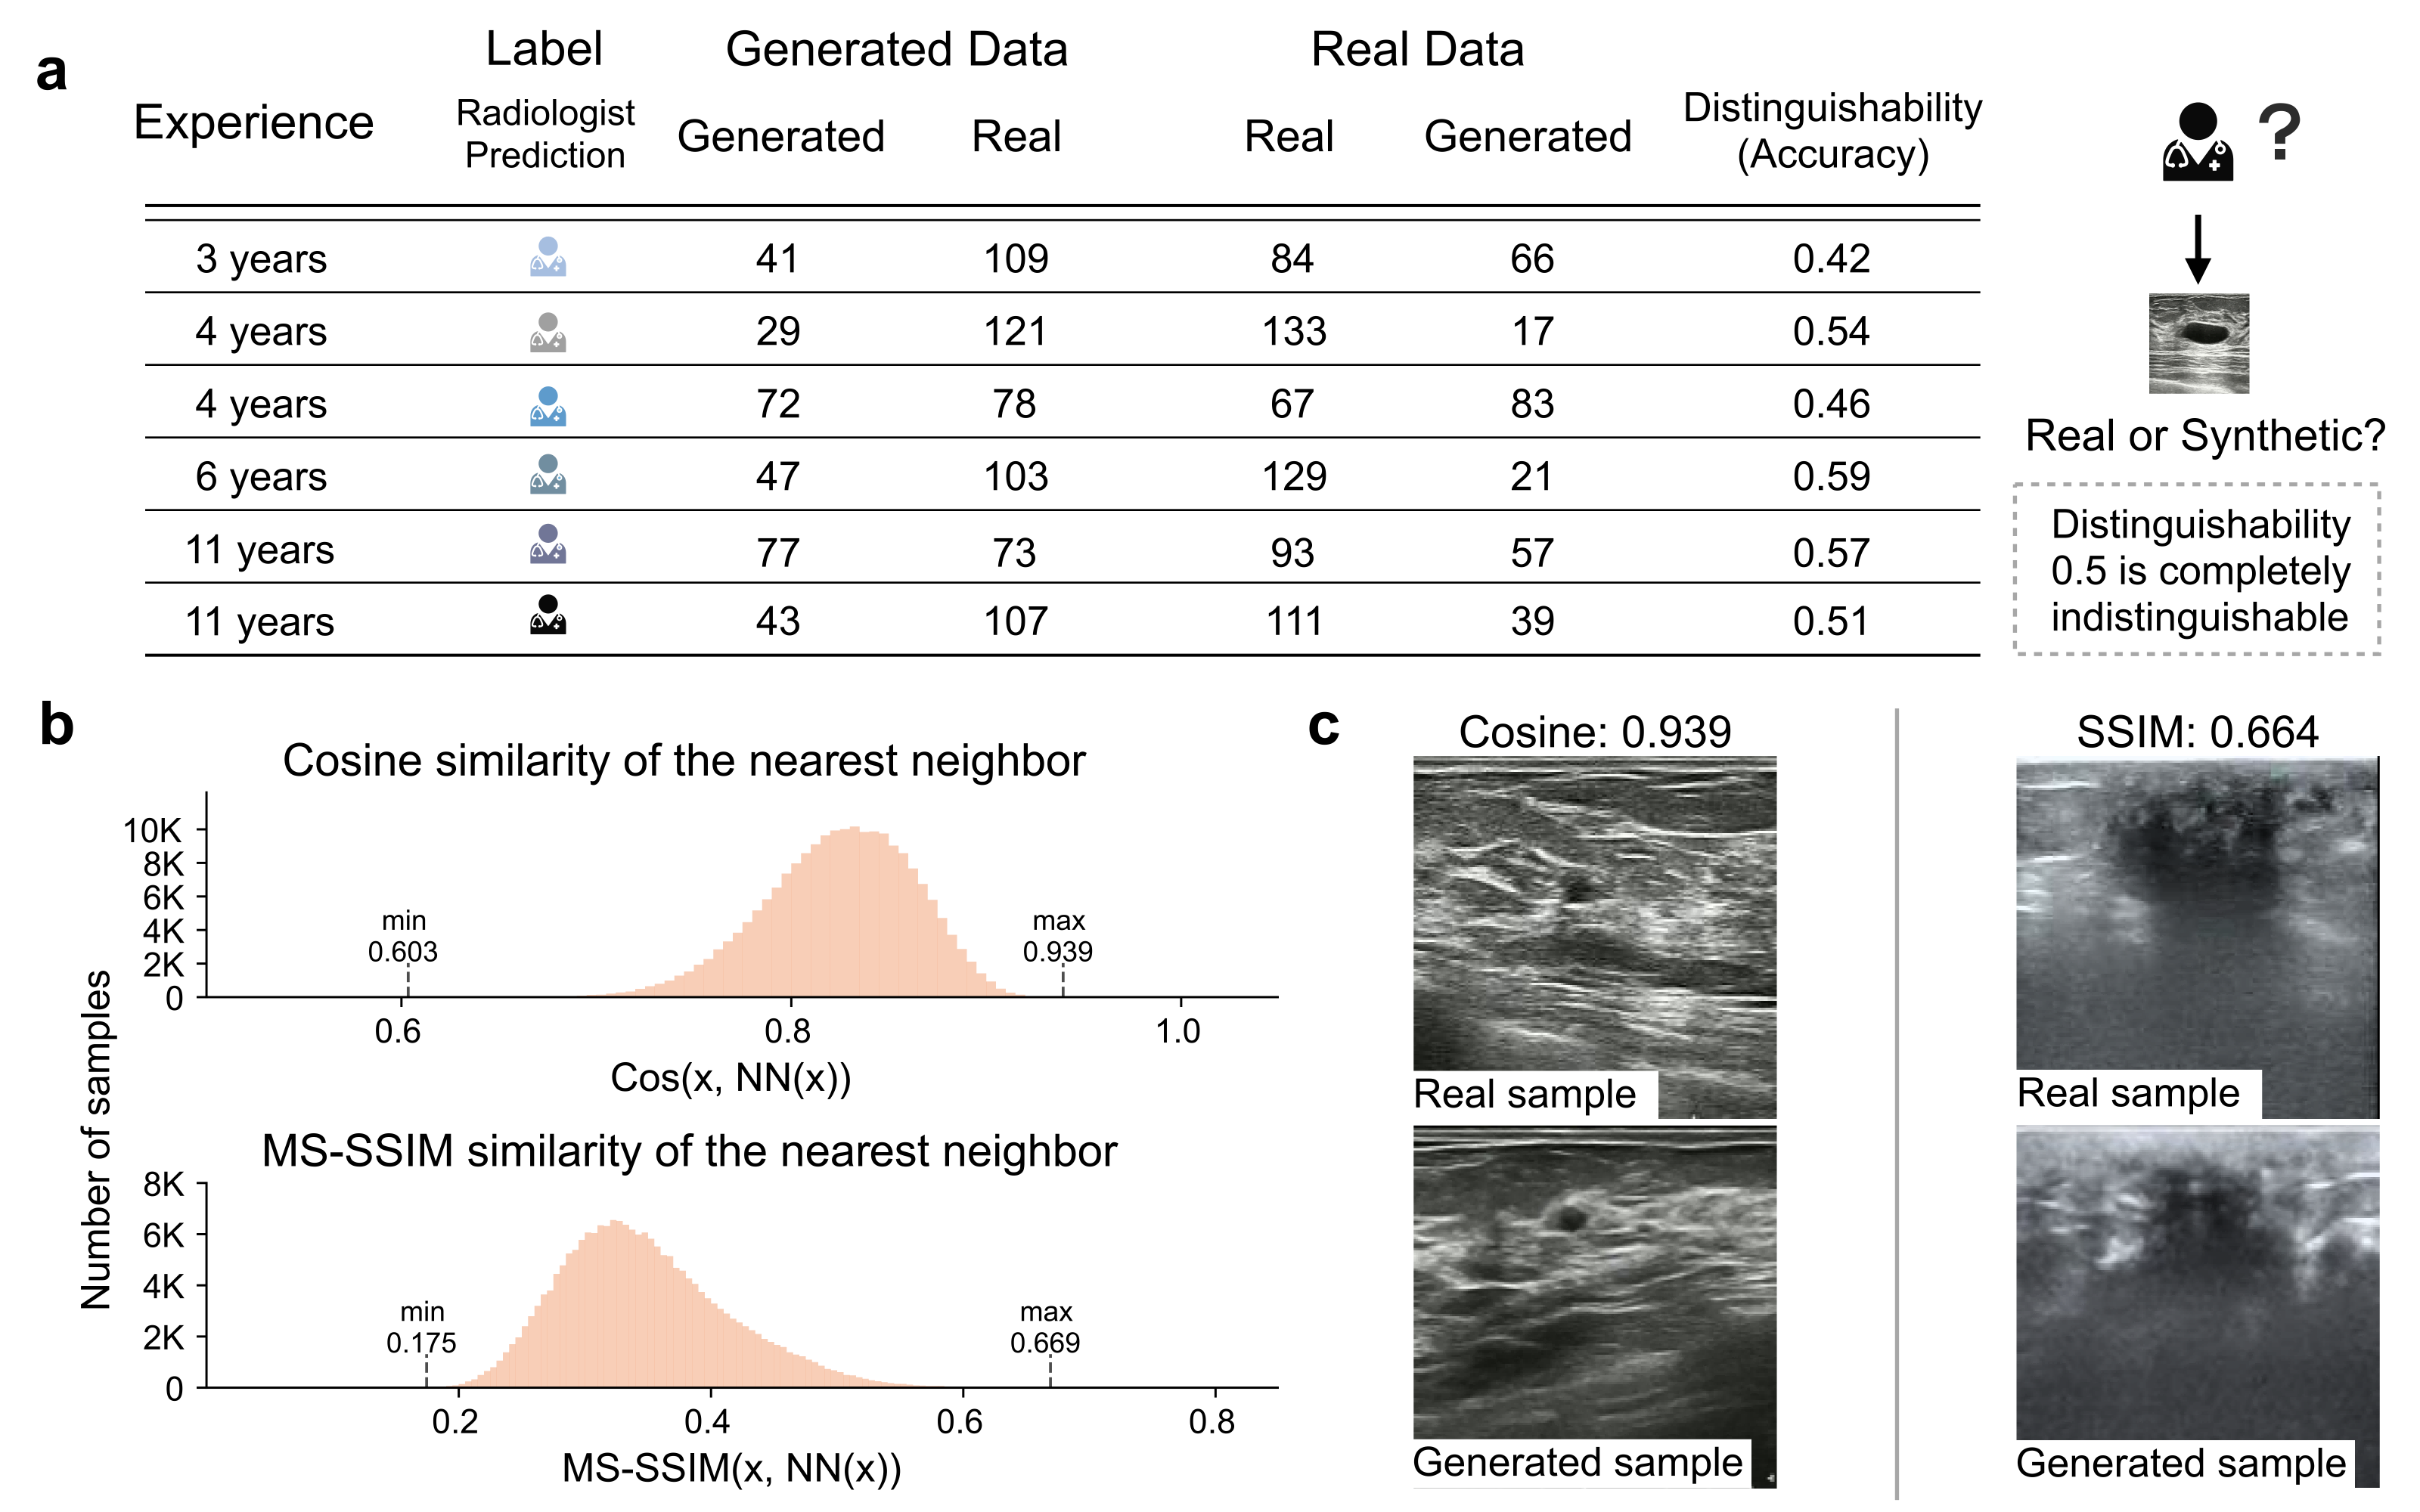
BUSGen can generate realistic data while protecting patient privacy. a, Results of Visual Turing Test. Six radiologists were asked to distinguish "fake" images generated by BUSGen from real images. They were presented with a set of 300 images, consisting of 150 generated and 150 real images. The distinguishability of real and synthetic data is near 0.50 (range: 0.42-0.59), indicating the synthetic data can not be reliably differentiated from real data. b, Distribution of cosine similarity and MS-SSIM scores in the feature space between generated samples and their nearest neighbor in the training data. This result indicates that BUSGen will not replicate its training data, as the highest cosine similarity is 0.939 and highest MS-SSIM is 0.669. c, Visualization of two pairs of generated and real images with the highest cosine similarity scores. As shown in the plots, these image pairs are not exact replications.
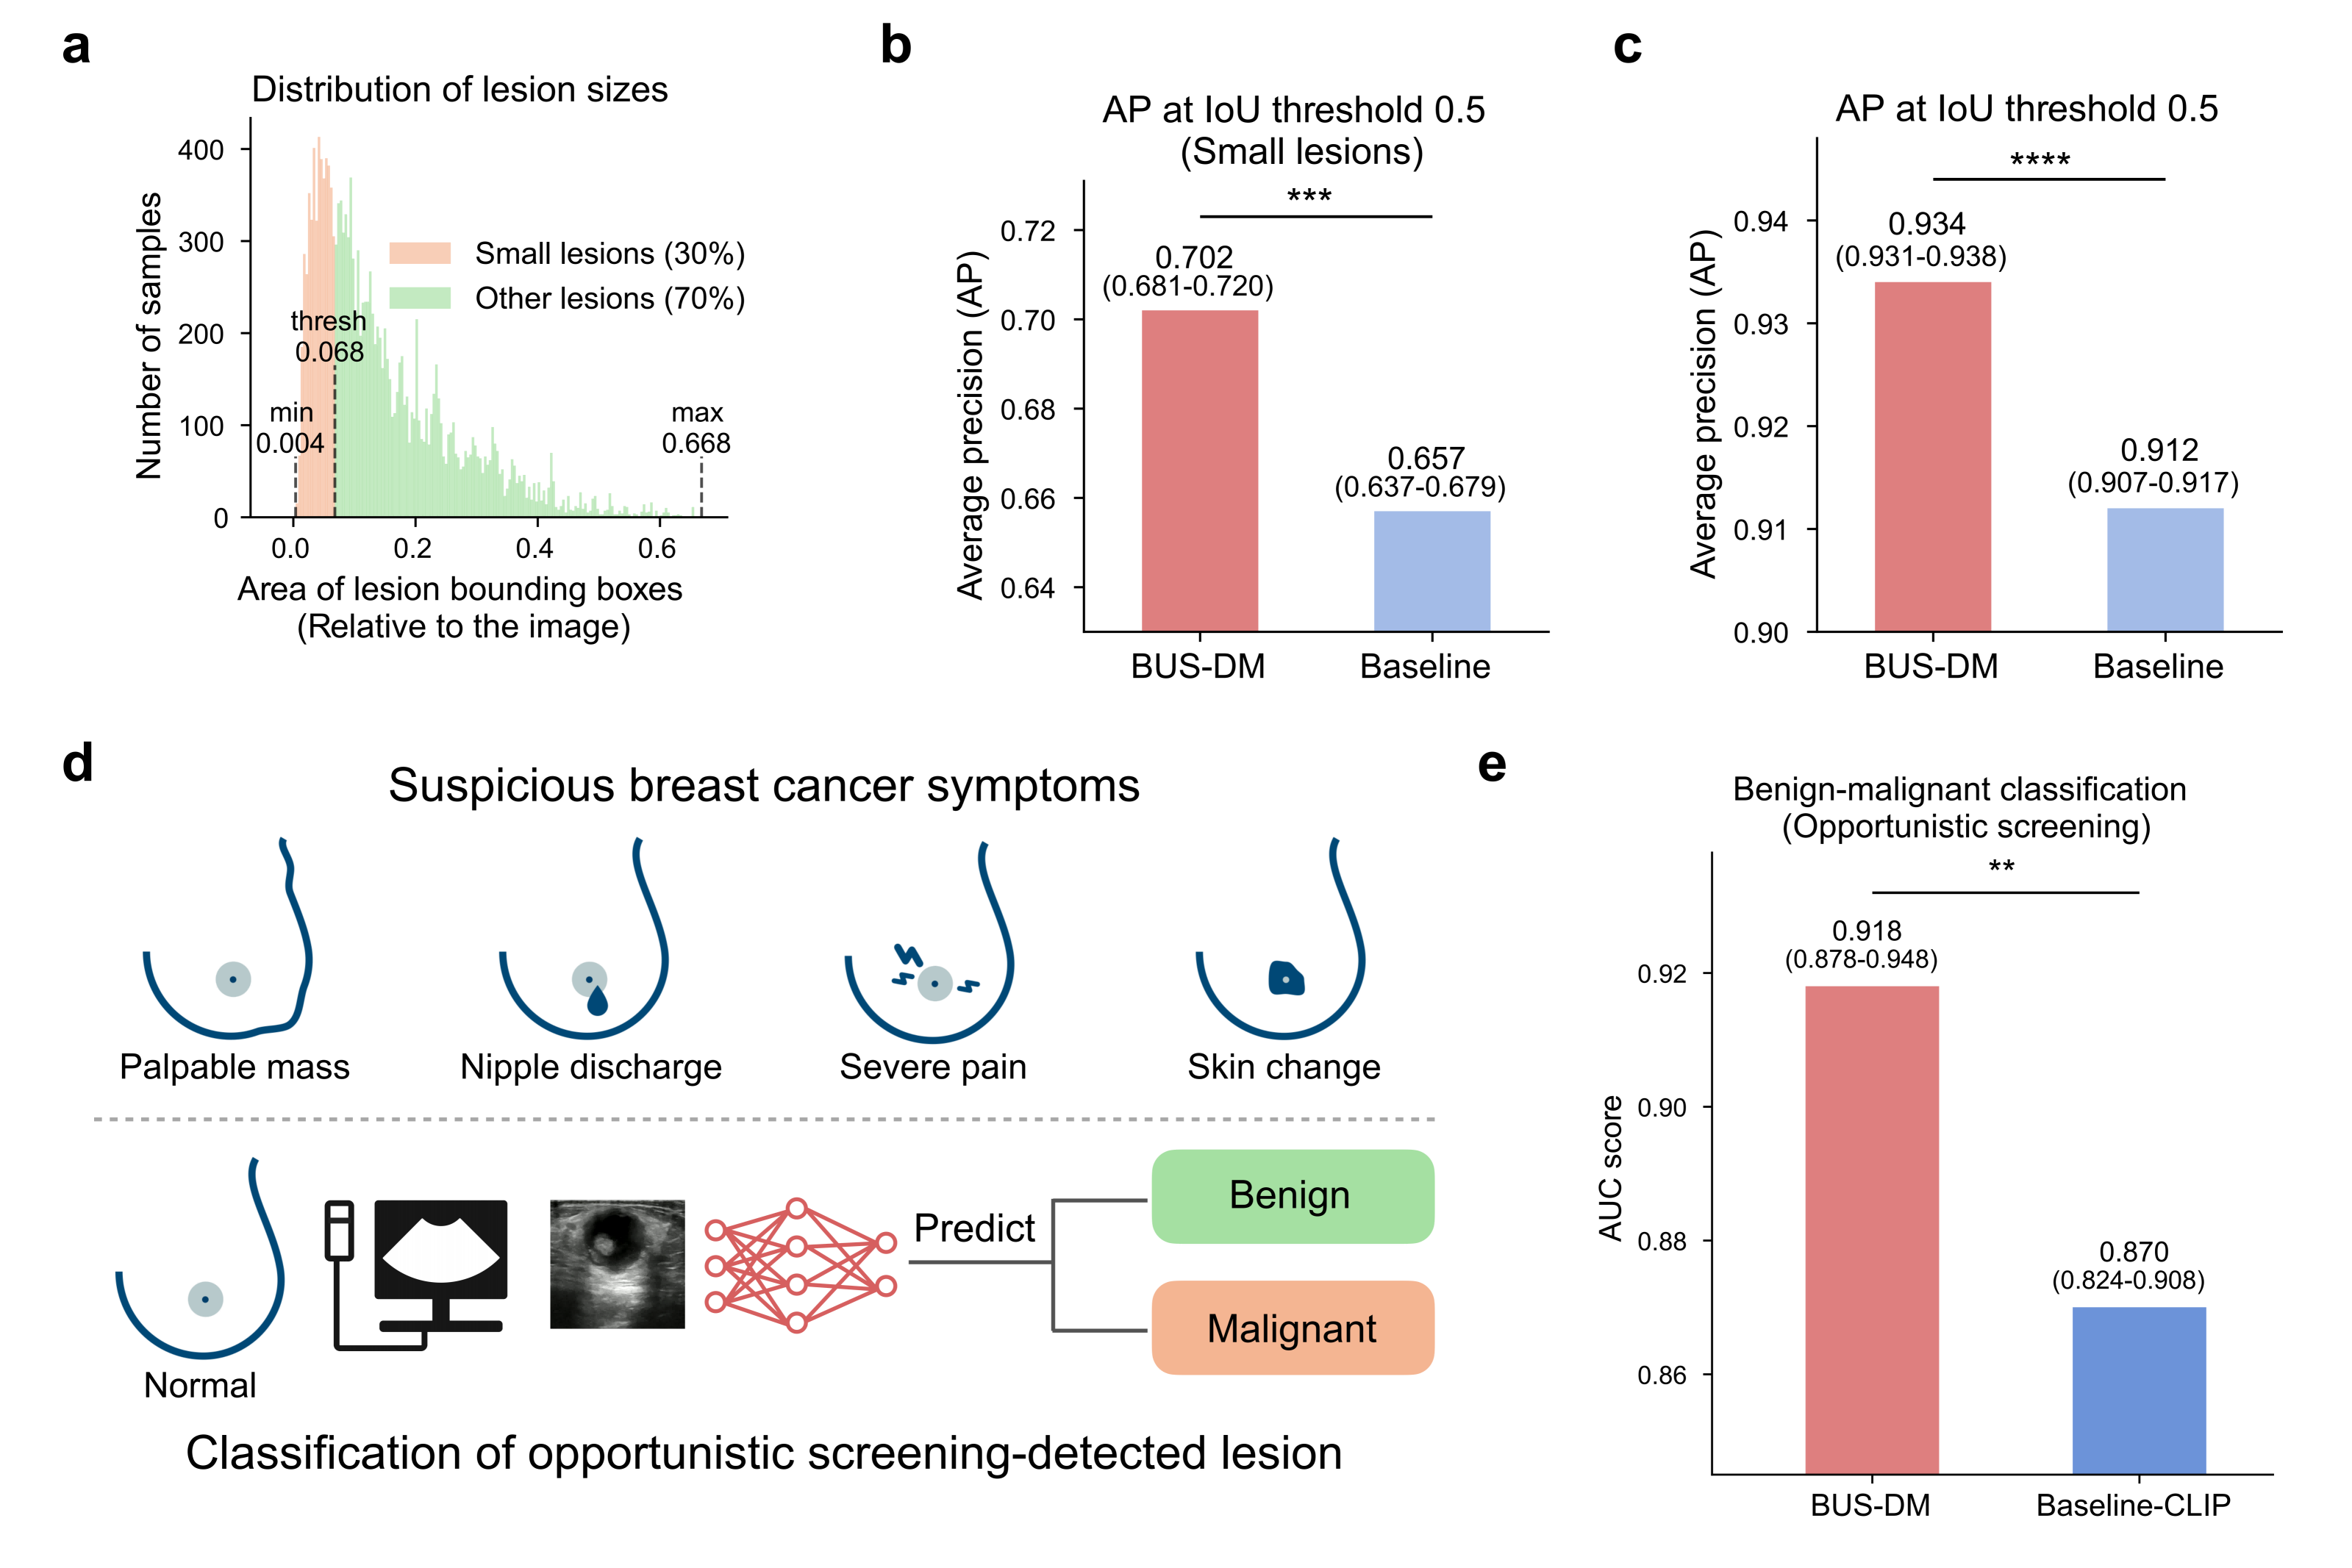
BUSGen improves breast cancer screening tasks. a, Distribution of lesion sizes. The smallest 30% lesions (orange) are defined as lesions with areas smaller than 0.068 (relative to images), which can be hard for radiologists to detect during ultrasound scanning. b, Comparison of BUS-DM (red) and Baseline (light blue) in small lesion detection (n=16,896). We report Average Precision (AP) at an Intersection over Union (IoU) threshold of 0.5. BUS-DM achieved an APsmall of 0.702 (95% CI: 0.681-0.720) and outperformed Baseline (blue; APsmall: 0.657; 95% 0.637-0.679; P-value=0.0017). A two-sided independent two-sample t-test was performed. c, Comparison of BUS-DM (red) and Baseline (light blue) in lesion detection (n=28,150). BUS-DM achieved an AP of 0.934 (95% CI: 0.931-0.938) and significantly outperformed Baseline (blue; AP: 0.912; 95% 0.907-0.917; P-value<0.0001). d, Illustration of opportunistic screening and classification tasks. The opportunistic screening is performed on a population without suspicious symptoms of breast cancer. The suspicious breast cancer symptoms include palpable mass, nipple discharge, severe pain and skin change (upper). Using deep learning models, we predict whether opportunistic screening-detected lesions are benign or malignant (lower). e, Comparison of BUS-DM (red) with Baseline-CLIP (blue) for benign-malignant classification of opportunistic screening-detected lesions. BUS-DM achieved a higher AUC of 0.918 (95% CI: 0.878-0.948) compared to Baseline-CLIP with an AUC of 0.870 (95% CI: 0.824-0.908; P-value=0.0074). **P-value< 0.01; ***P-value< 0.001; ****P-value<0.0001.
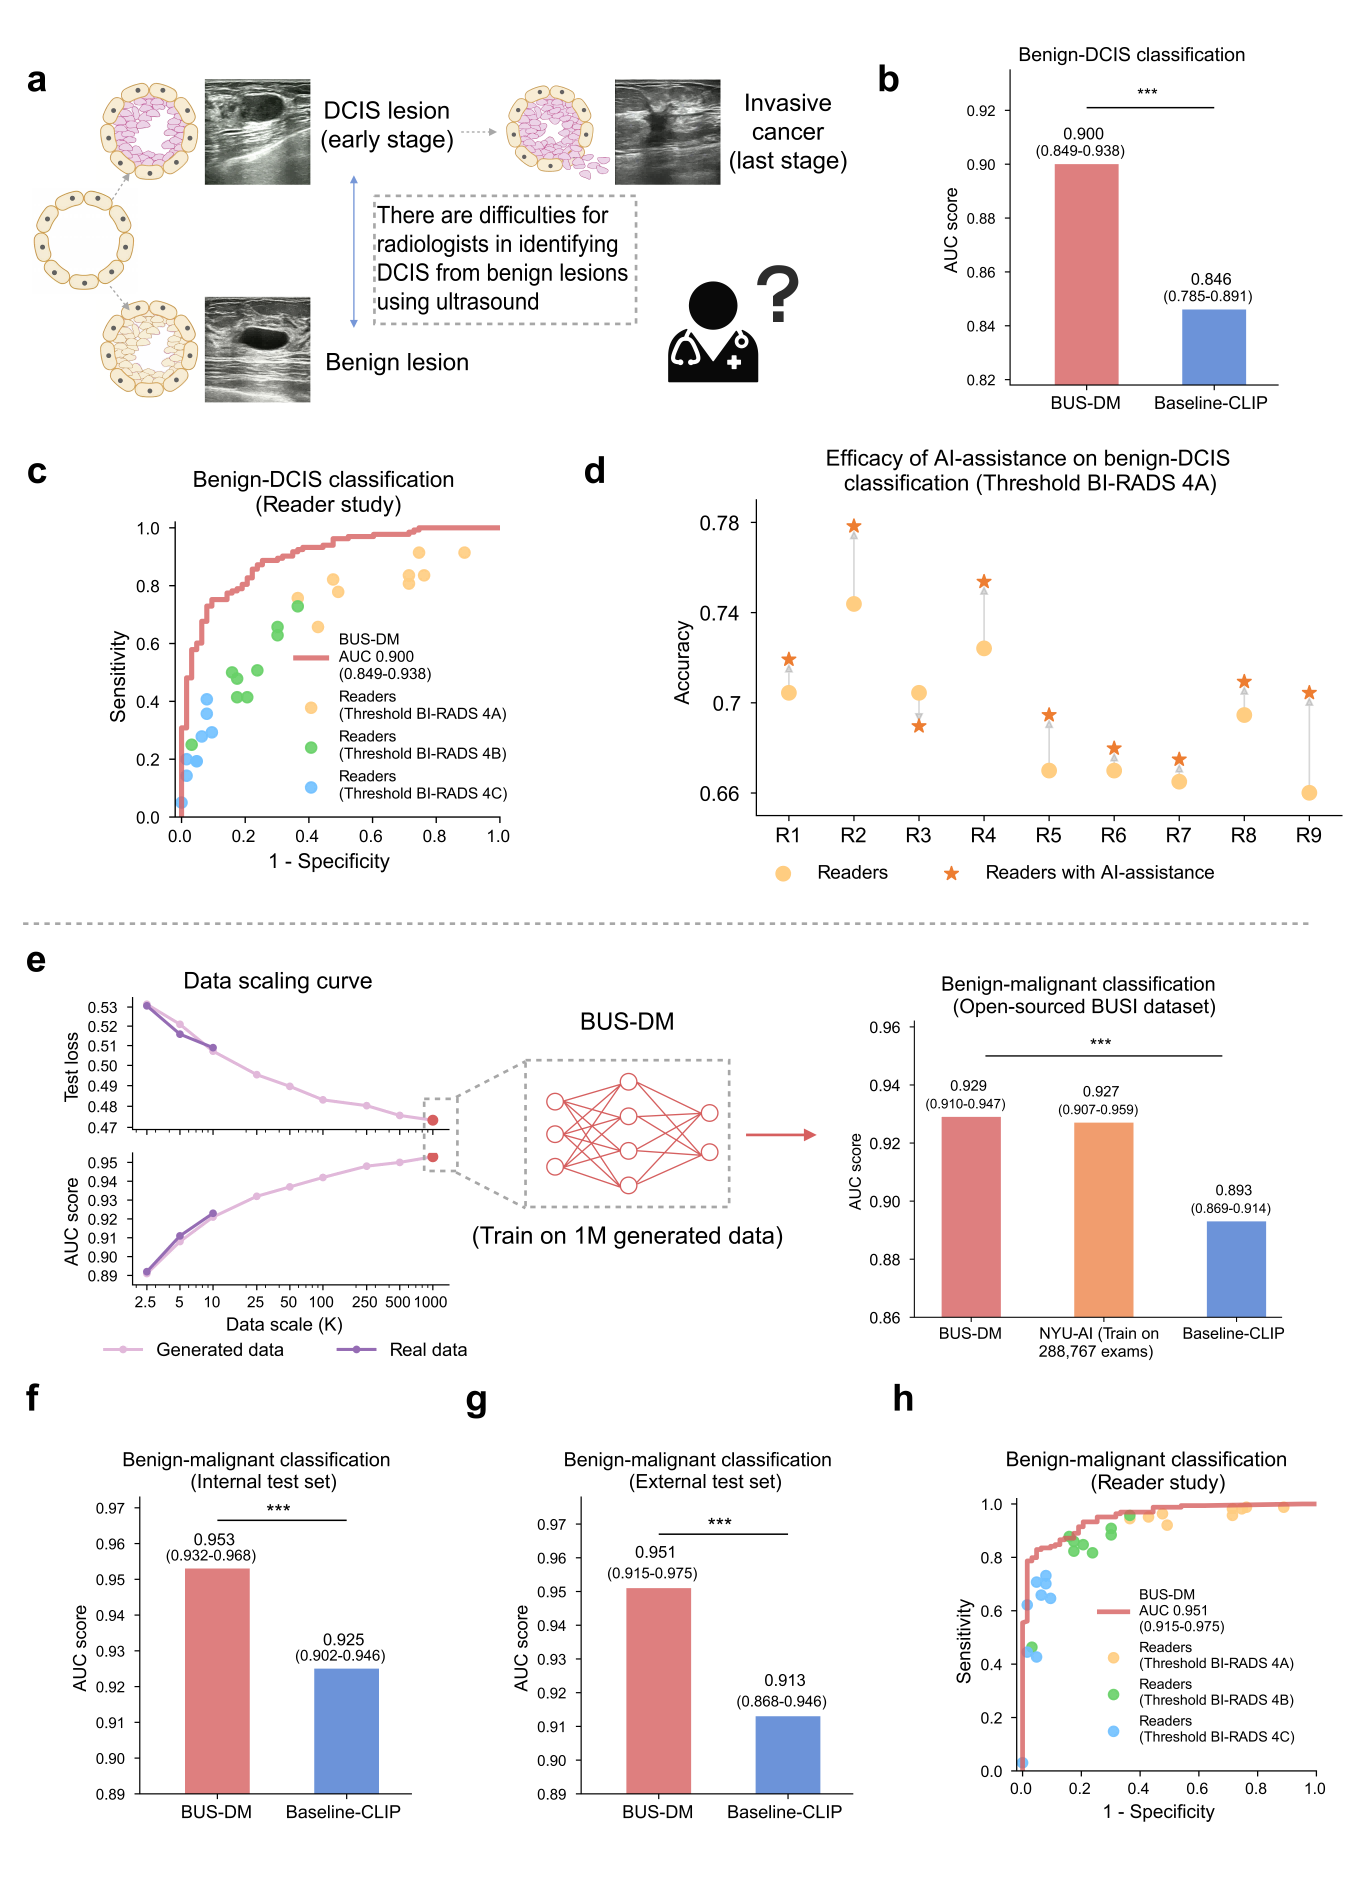
BUSGen enhances breast ultrasound diagnosis. a, Breast cancer early diagnosis involved the identification of DCIS (early-stage cancer) from benign lesions, which was considered difficult for radiologists based on ultrasound images. b, Comparison of BUS-DM (red) with Baseline-CLIP (blue) in the early diagnosis task for benign-DCIS classification. BUS-DM achieved a higher AUC of 0.900 (95% CI: 0.849-0.938) compared to the Baseline-CLIP with an AUC of 0.846 (95% CI: 0.785-0.891; P-value=0.0002). c, Comparison of BUS-DM with board-certified radiologists (n=9; 11 years of experience on average) in breast cancer early diagnosis. The ROC curves of BUS-DM (red curve) and diagnostic results of radiologists (dots) show that BUS-DM outperformed radiologists by a large margin. The colors (blue, green, and orange) of the dots represent radiologists' results calculated via different thresholds. d, Accuracy improvements of radiologists with the assistance of BUS-DM. We report the accuracy of radiologists in breast cancer early diagnosis, as well as their accuracy after considering BUS-DM predictions. Accuracy is calculated using the threshold of BI-RADS 4A. e, The data scaling curves of test loss (upper part of the left plot) and AUC score (lower part of the left plot) of diagnostic models trained on different scales of real collected data (dark purple) and BUSGen generated data (light purple). The curves for real and generated data closely align at small data scales, with the generated data continuously enhancing downstream performance as the number of generated samples increases. By scaling up the generated data to 1 million samples, we developed BUS-DM (AUC: 0.929; 95% CI: 0.910-0.947) that achieved comparable performance to NYU-AI (trained on 288,767 real samples; AUC: 0.927; 95% CI: 0.907-0.959), and outperformed Baseline-CLIP (AUC: 0.893; 95% CI: 0.869-0.914; P-value=0.0006) on the BUSI test set (n=780). f, Comparison of BUS-DM (red) with Baseline-CLIP (blue) on the internal diagnosis test set for benign-malignant classification (n=579). BUS-DM achieved a higher AUC of 0.953 (95% CI: 0.932-0.968) compared to the Baseline-CLIP with an AUC of 0.925 (95% CI: 0.902-0.946; P-value=0.0006). g, Comparison of BUS-DM (red) with Baseline-CLIP (blue) on the external diagnosis test set for benign-malignant classification (n=227). BUS-DM achieved a higher AUC of 0.951 (95% CI: 0.915-0.975) compared to the Baseline-CLIP with an AUC of 0.913 (95% CI: 0.868-0.946; P-value=0.0007). Note that BUS-DM, trained only on generated data, enjoyed better generalization ability than baseline models trained on real data. h, Comparison of BUS-DM with board-certified radiologists (n=9) of the diagnosis task (benign-malignant classification) on the external test set. The ROC curves of BUS-DM (red curve) and diagnostic results of radiologists (dots) show that BUS-DM outperformed the average performance of radiologists. ***P-value<0.001.
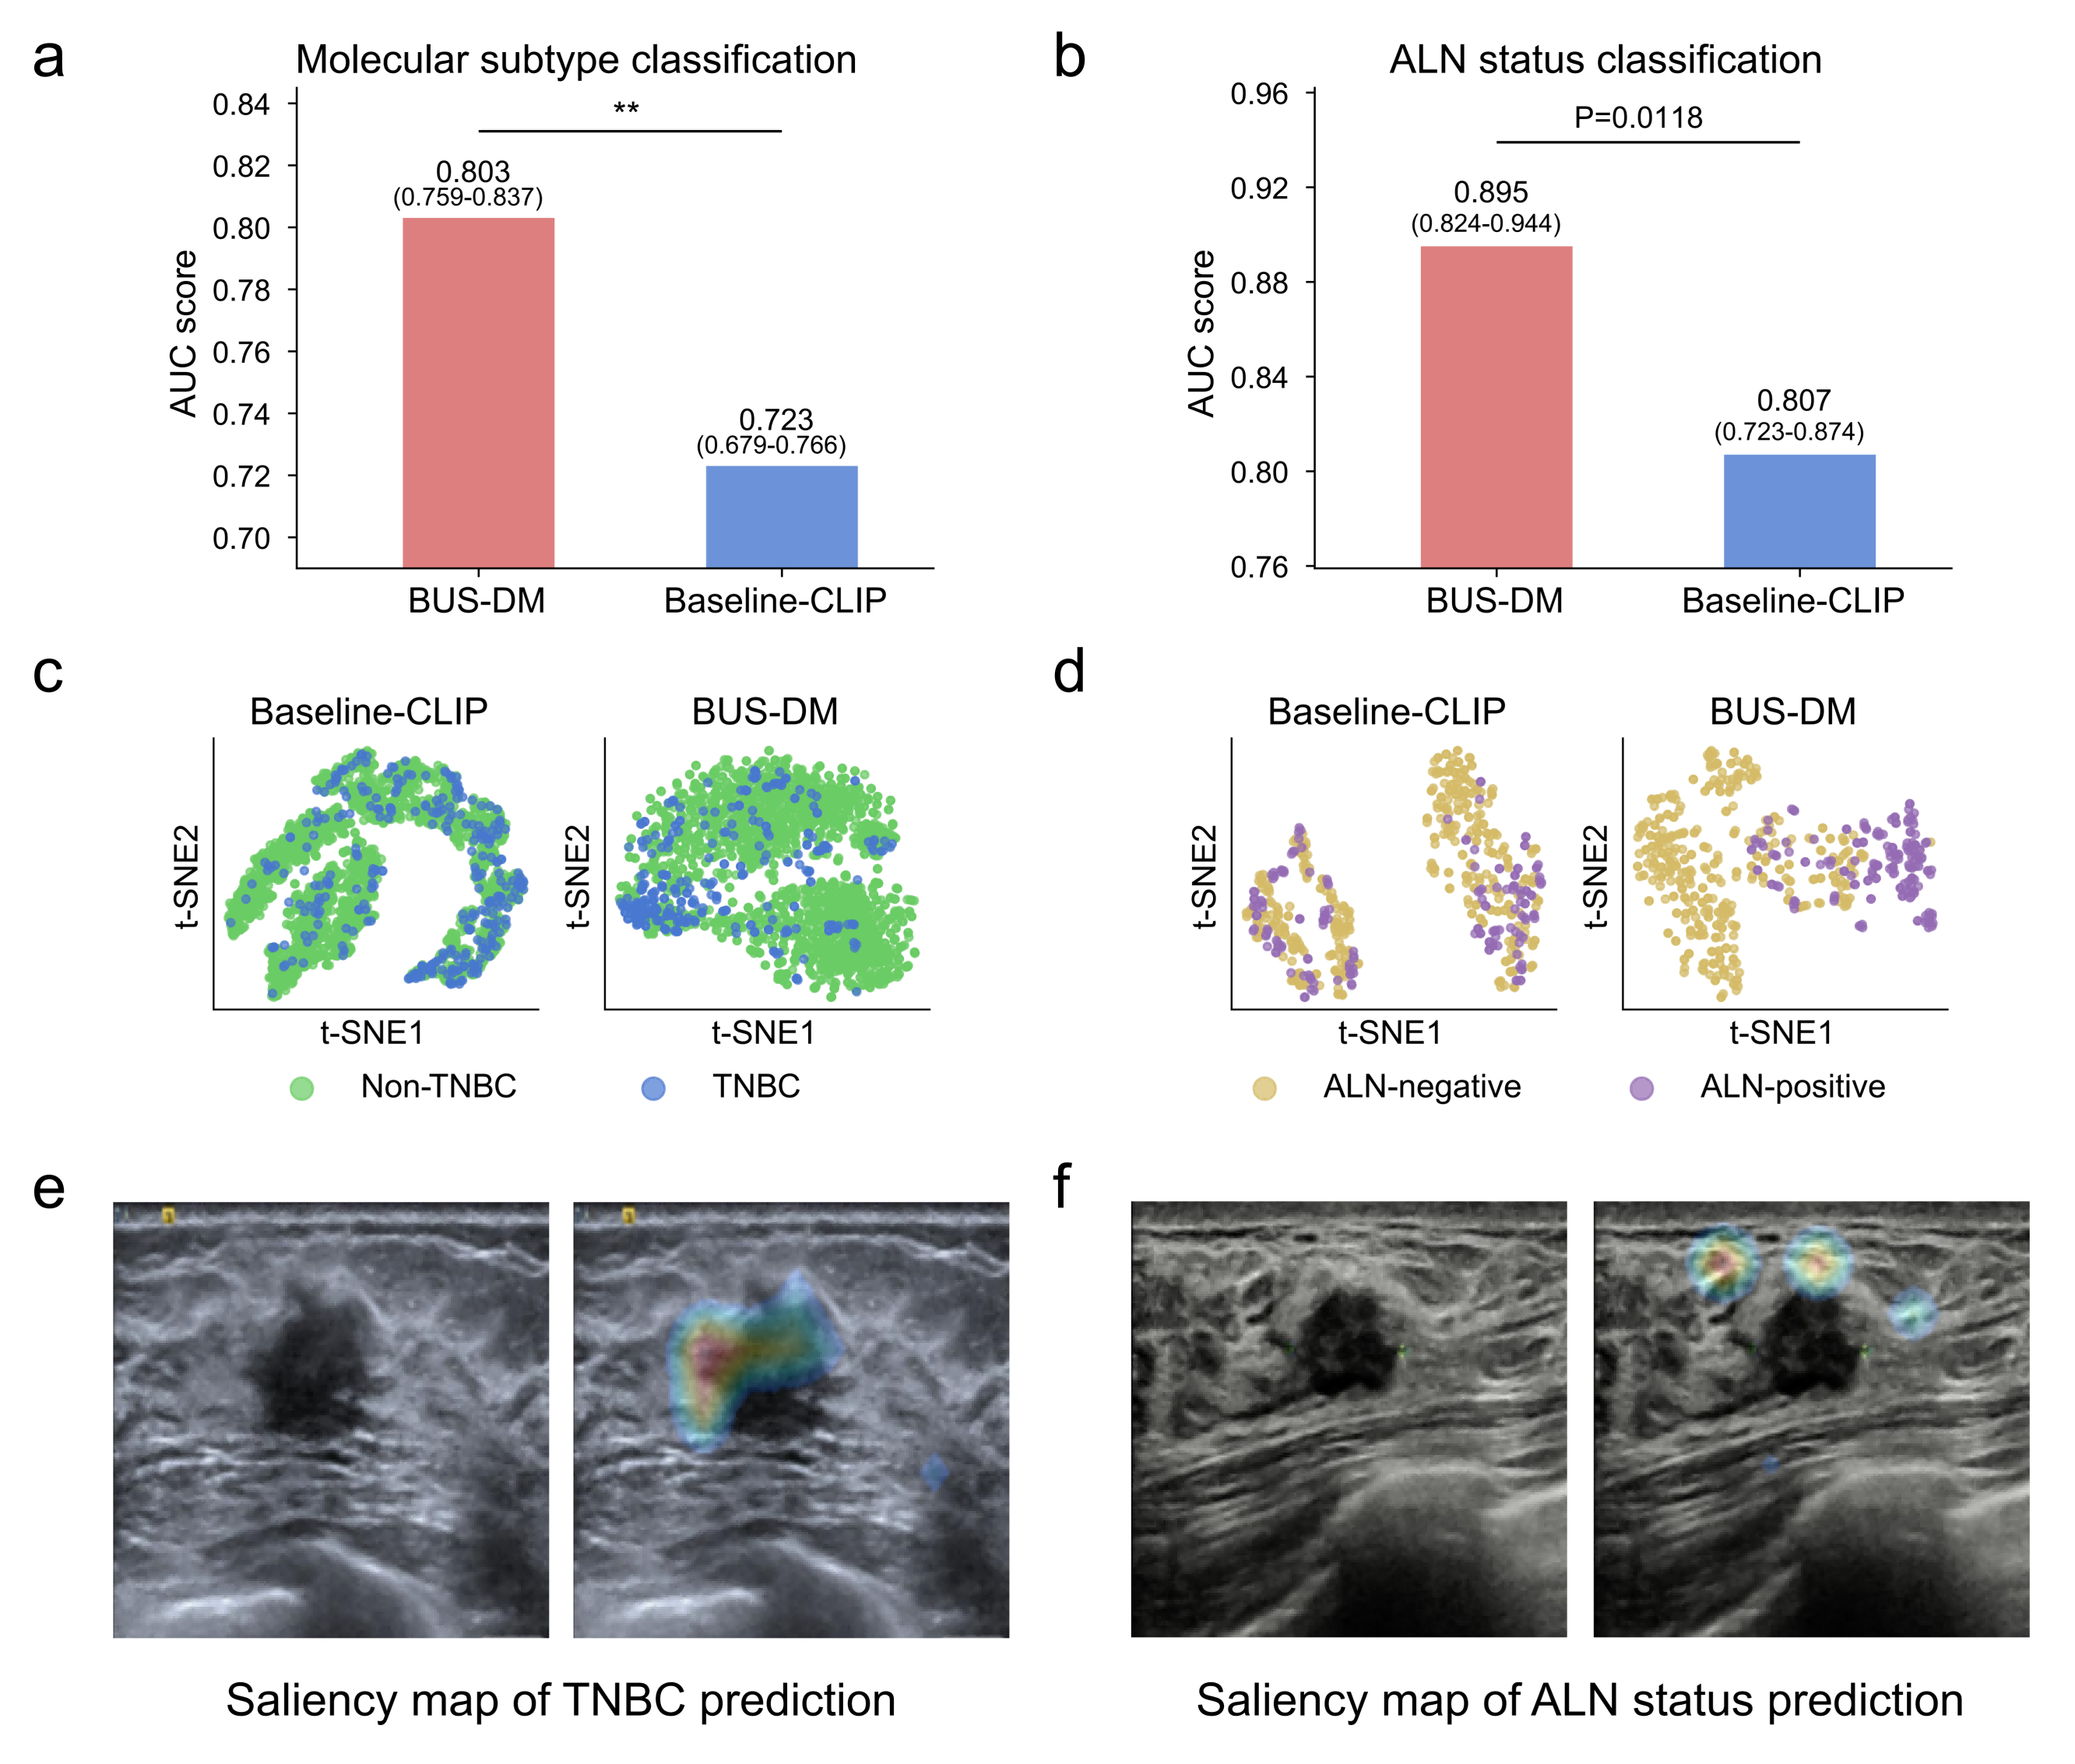
BUSGen facilitates breast cancer prognosis. a, Comparison of BUS-DM (red) with Baseline-CLIP (blue) in molecular subtype classification (TNBC vs. non-TNBC). BUS-DM achieved a higher AUC of 0.803 (95% CI: 0.759-0.837) compared to the Baseline-CLIP with an AUC of 0.723 (95% CI: 0.679-0.766; P-value=0.0046). b, Comparison of BUS-DM (red) with Baseline-CLIP (blue) in ALN metastasis status classification (ALN-negative vs. ALN-positive). BUS-DM achieved a higher AUC of 0.895 (95% CI: 0.824-0.944) compared to the Baseline-CLIP with an AUC of 0.807 (95% CI: 0.723-0.874; P-value=0.0118). c, t-SNE plots of classification features (referred to as [CLS]) of downstream models in molecular subtype prediction. Clusters of TNBC and non-TNBC of BUS-DM [CLS] features are more concentrated than [CLS] features of Baseline-CLIP. d, t-SNE plots of [CLS] features in the ALN status classification. Clusters of ALN-negative and ALN-positive BUS-DM [CLS] features are more concentrated than [CLS] features of Baseline-CLIP. e, Saliency map of molecular subtype prediction by BUS-DM. The upper-left part of the lesion margin is highlighted by BUS-DM in predicting TNBC. f, Saliency map of ALN status prediction by BUS-DM, which pays more attention to the surrounding glandular tissues of the lesion for predicting ALN metastasis. **P-value < 0.01.
Author contributions
H.Yu. and L.W. conceived and designed the study. Z.N., B.T., Y.Lu. and X.G. carried out data acquisition. Y.Li., H.Yu., Y.Lu., Z.N. and Q.W. carried out data processing and annotation. H.Yu. developed the AI models. Y.Li. carried out generated data cleaning. Y.Li. developed the platform for reader study. N.Z., Z.N., W.Q., J.T., M.Z., X.G., J.H., L.H. and Y.W. participated in the reader study. H.Yu., H.Ye., S.H., D.H., Y.Li., N.Z., Z.N., D.W., Z.Z., Q.W., D.D., Q.Z., J.Z. and L.W. wrote and revised the paper.